> ## Documentation Index
> Fetch the complete documentation index at: https://goldenpocket.mintlify.site/llms.txt
> Use this file to discover all available pages before exploring further.

# 📈 Performance Analytics

> Comprehensive performance metrics and analysis tools

## Performance Metrics Dashboard

<Frame>
  <div style={{pointerEvents: "none", overflow: "visible", height: "80px", display: "flex", alignItems: "center", justifyContent: "center"}}>
    <img src="https://mintcdn.com/goldenpocket/_uRtd3IvLu55XfG-/feature-images/Performance-Metrics-Dashboard.png?fit=max&auto=format&n=_uRtd3IvLu55XfG-&q=85&s=984947f42d2237ad38d142ae7be5b9c2" style={{width: "100%", height: "auto", transform: "scale(2.3)", transformOrigin: "center"}} alt="Performance metrics dashboard showing key trading analytics" width="2394" height="314" data-path="feature-images/Performance-Metrics-Dashboard.png" />
  </div>
</Frame>

A dynamic set of performance metrics update based on applied filters.

### Metrics Included

* **Trades** — Total trades in the selected period
* **PnL** — Profit or loss for the selected period (filters applied)
* **Win Rate** — Percentage of winning trades with win/loss counts
* **Average Duration** — Mean holding time per trade
* **Long / Short Ratio** — Directional bias breakdown

<Note>
  **Total PnL lives on Overview.** This page's **PnL** reflects the currently selected period and filters.
</Note>

### Key Insights

* Measure consistency and directional edge
* Understand holding behavior across different market regimes

## PnL Chart

<div style={{width: "87%"}}>
  <Frame>
    <div style={{pointerEvents: "none", overflow: "visible", height: "250px", display: "flex", alignItems: "center", justifyContent: "center"}}>
      <img src="https://mintcdn.com/goldenpocket/TacfhPc_mSXYyJbq/feature-images/pnl-chart.png?fit=max&auto=format&n=TacfhPc_mSXYyJbq&q=85&s=5428e6ccc941a9dfc397c5b27936f329" style={{width: "100%", height: "auto", transform: "scale(7.1)", transformOrigin: "center"}} alt="PnL chart showing cumulative PnL over time" width="2394" height="1066" data-path="feature-images/pnl-chart.png" />
    </div>
  </Frame>
</div>

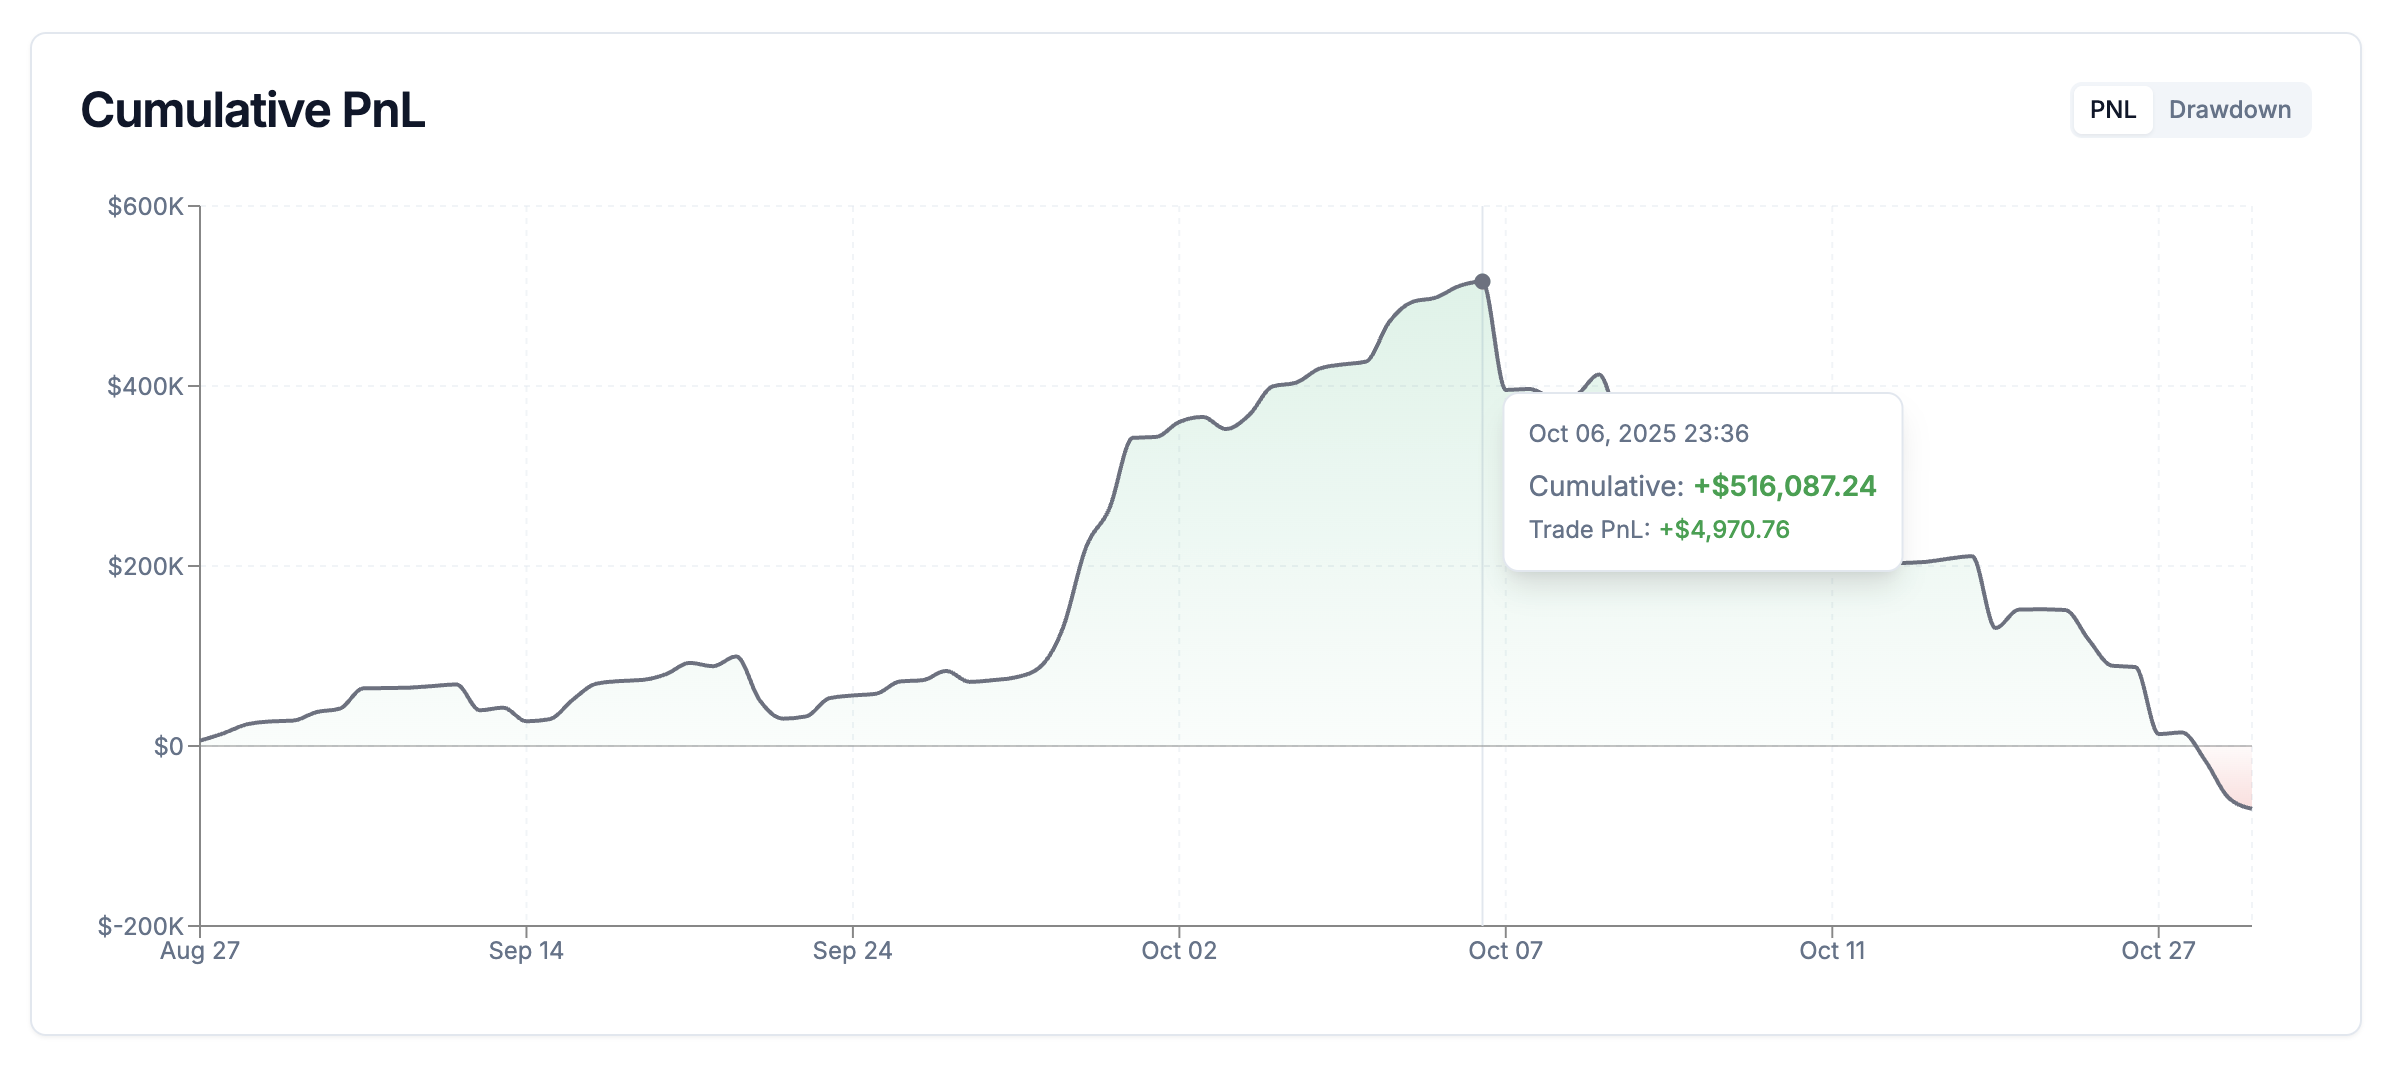
A cumulative PnL curve visualizes long-term performance progression and volatility.

### How to use

* View PnL progression over time
* Hover for exact values
* Fully respects active filters
* Toggle between PnL and Drawdown views

### Key Insights

* Identify strong and weak performance phases
* Evaluate consistency versus volatility

## Drawdown Chart

<div style={{width: "87%"}}>
  <Frame>
    <div style={{pointerEvents: "none", overflow: "visible", height: "250px", display: "flex", alignItems: "center", justifyContent: "center"}}>
      <img src="https://mintcdn.com/goldenpocket/TacfhPc_mSXYyJbq/feature-images/drawdown-chart.png?fit=max&auto=format&n=TacfhPc_mSXYyJbq&q=85&s=f5895ca56a0ded27c0f8e06adacaed20" style={{width: "100%", height: "auto", transform: "scale(7.1)", transformOrigin: "center"}} alt="Drawdown chart showing peak-to-trough losses over time" width="2394" height="1066" data-path="feature-images/drawdown-chart.png" />
    </div>
  </Frame>
</div>

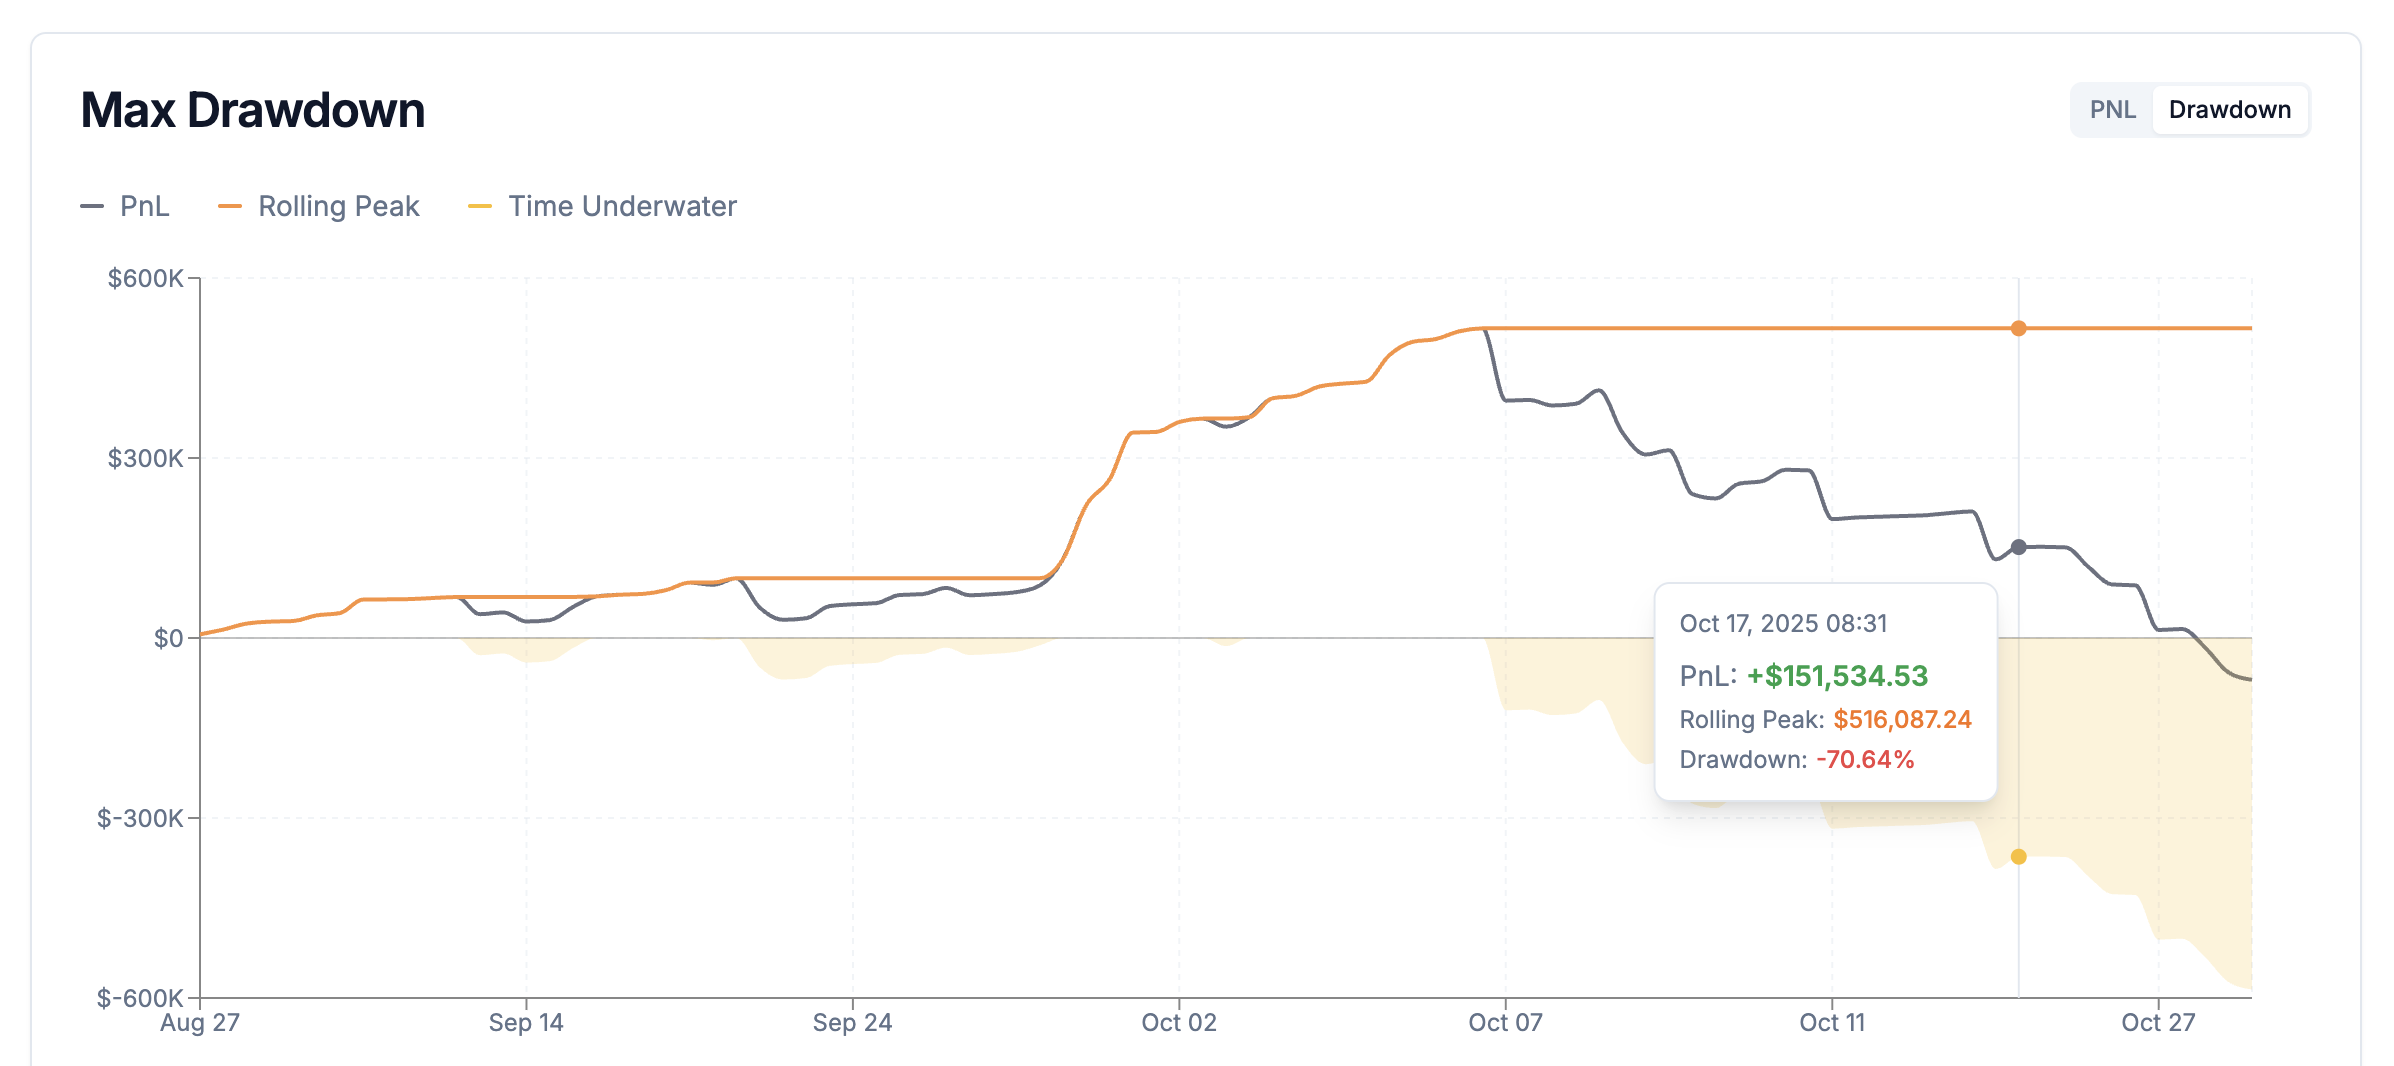
A visualization of peak-to-trough losses measures downside risk and recovery behavior.

### How to use

* View percentage drawdown from historical peaks
* Identify maximum drawdown periods
* Switch via chart mode selector

### Key Insights

* Understand worst-case scenarios
* Evaluate whether risk aligns with your tolerance

## Trade Analysis Candles

<div style={{width: "87%"}}>
  <Frame>
    <div style={{pointerEvents: "none", overflow: "visible", height: "250px", display: "flex", alignItems: "center", justifyContent: "center"}}>
      <img src="https://mintcdn.com/goldenpocket/a3PrsyoQYMI4F2YI/feature-images/trade-analysis.jpeg?fit=max&auto=format&n=a3PrsyoQYMI4F2YI&q=85&s=6ea0c5d087ccac76b1f42b4f6220dde8" style={{width: "100%", height: "auto", transform: "scale(7.1)", transformOrigin: "center"}} alt="Trade analysis candlestick view showing per-trade PnL with MFE and MAE wicks" width="2338" height="1094" data-path="feature-images/trade-analysis.jpeg" />
    </div>
  </Frame>
</div>

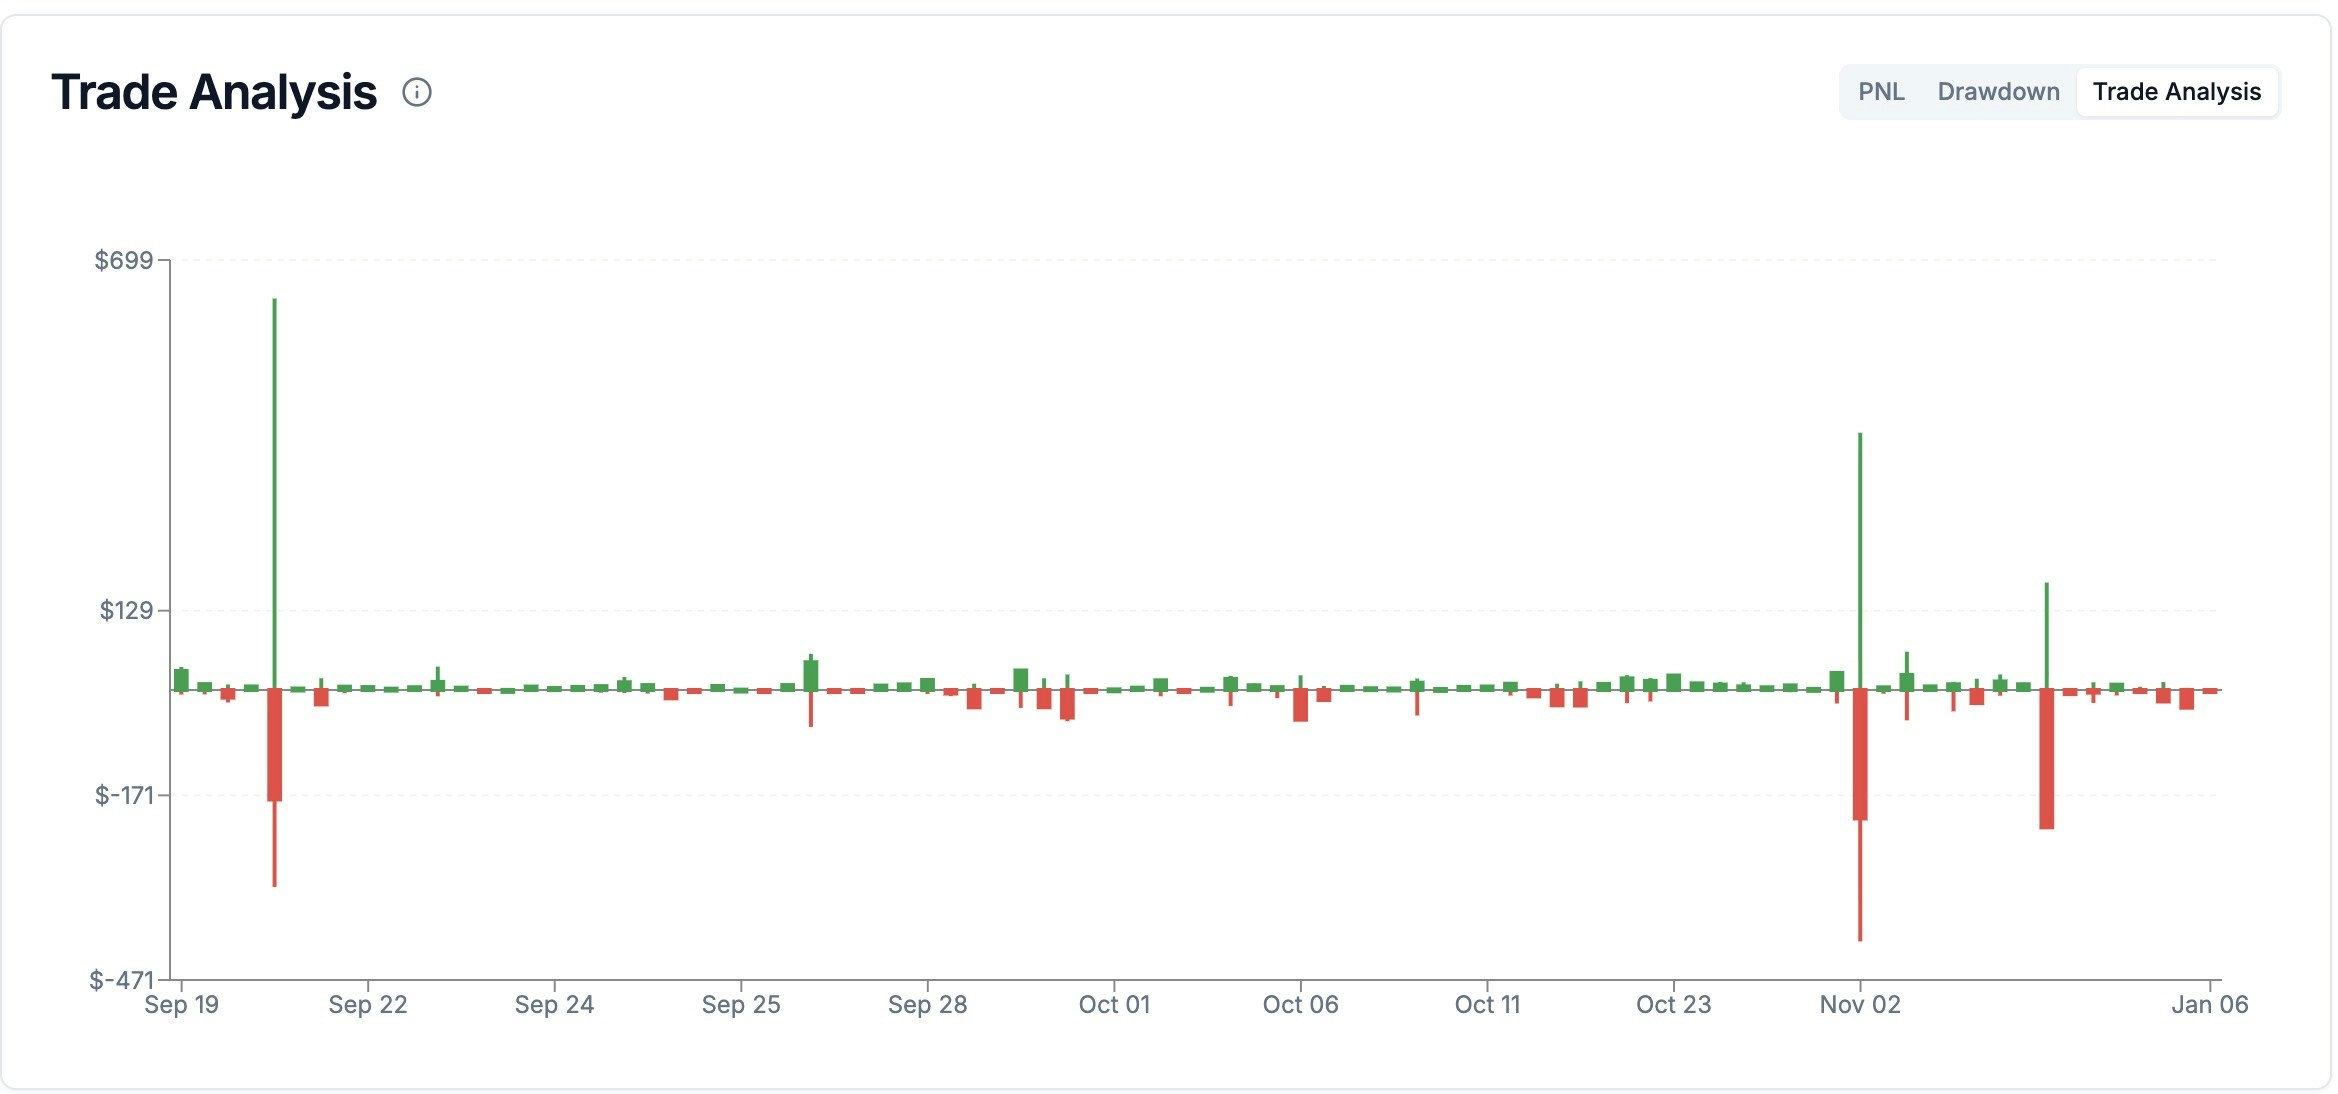
A per-trade PnL candlestick view that shows how each trade behaved from entry to exit. Each candle represents one trade: the body is final realized PnL, the upper wick is maximum unrealized profit (MFE), and the lower wick is maximum unrealized loss (MAE).

### How to use

* Identify trades where you gave back large unrealized profits
* See which entries go deep into drawdown before working
* Compare trade management quality across different market conditions
* Use alongside filters to analyze specific symbols, dates, or strategies

### Key Insights

* Reveal execution inefficiencies that normal PnL metrics hide
* Improve stop-loss placement and profit-taking decisions

## Time Period Performance

<Frame>
  <div style={{pointerEvents: "none", overflow: "visible", height: "80px", display: "flex", alignItems: "center", justifyContent: "center"}}>
    <img src="https://mintcdn.com/goldenpocket/_uRtd3IvLu55XfG-/feature-images/Time-Period-Performance.png?fit=max&auto=format&n=_uRtd3IvLu55XfG-&q=85&s=c2f14dffb554aa11e54222e3dc139e90" style={{width: "100%", height: "auto", transform: "scale(2.3)", transformOrigin: "center"}} alt="Time period performance showing 24h, 48h, weekly, and monthly breakdowns" width="2384" height="262" data-path="feature-images/Time-Period-Performance.png" />
  </div>
</Frame>

**What it is:** 24h, 48h, weekly, and monthly performance breakdowns.

**What it's for:** Identifies consistency and temporal performance patterns.

### How to use

* Review PnL and trade count per time bucket
* Spot profitable and unprofitable periods

### Key Insights

* Detect seasonality and streak behavior
* Understand performance concentration

## Symbol & Date Filters

<div style={{width: "93%"}}>
  <Frame>
    <div style={{pointerEvents: "none", overflow: "visible", height: "40px", display: "flex", alignItems: "center", justifyContent: "center"}}>
      <img src="https://mintcdn.com/goldenpocket/maoLbU78EBVlEcqn/feature-images/Symbol-Date-Filters.png?fit=max&auto=format&n=maoLbU78EBVlEcqn&q=85&s=e6d01a4ef493beac4c49c2390663819c" style={{width: "100%", height: "auto", transform: "scale(1.4)", transformOrigin: "center"}} alt="Symbol and date filters interface for focused analysis" width="2376" height="198" data-path="feature-images/Symbol-Date-Filters.png" />
    </div>
  </Frame>
</div>

Interactive filters enable focused analysis of specific assets, strategies, or market conditions by narrowing data by trading pair and time range.

### How to use

* **Symbol Filter:** Select individual symbols or "All Symbols"
* **Date Range:** Choose custom start and end dates

### Data Availability

* **Jupiter:** May 1st, 2025 onward (protocol data availability)
* **Backpack:** Full historical range based on your activity

### Key Insights

* Compare performance across assets
* Identify which markets and periods suit your strategy best