
Advanced Performance Metrics
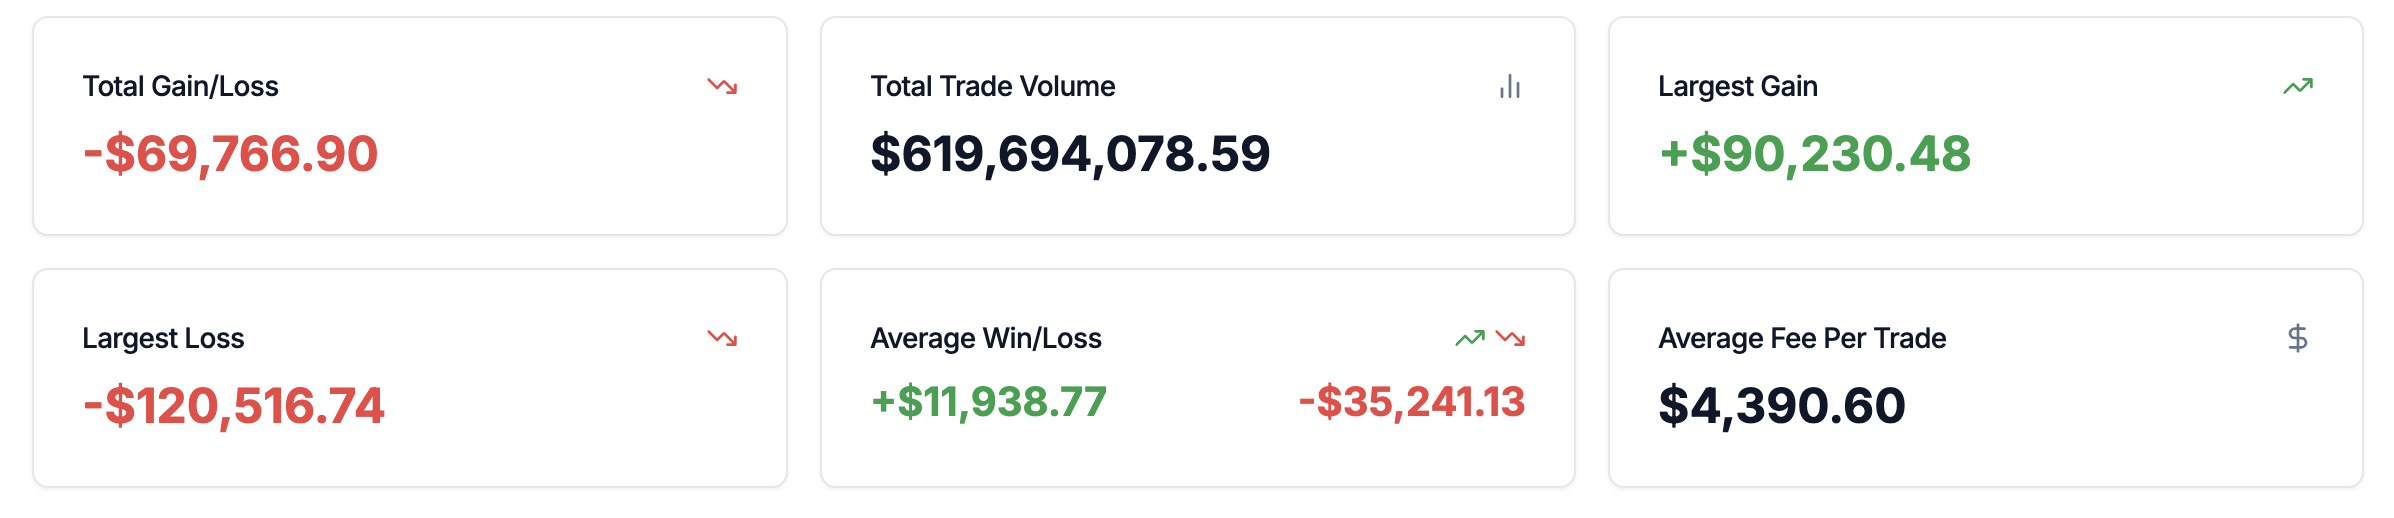
Metrics Included
- Total Gain / Loss — Sum of PnL from winning trades vs. losing trades
- Total Trade Volume — Cumulative notional traded (same concept as Total Volume on Overview)
- Largest Gain — Biggest single-trade profit in the filtered set
- Largest Loss — Biggest single-trade loss in the filtered set
- Average Win vs. Average Loss — Mean size of winning trades vs. losing trades
- Average Fee per Trade — Mean fees per trade
Key Insights
- Evaluate trade quality beyond win rate
- Assess whether winners outweigh losers
- Monitor execution efficiency
Long vs. Short Analysis
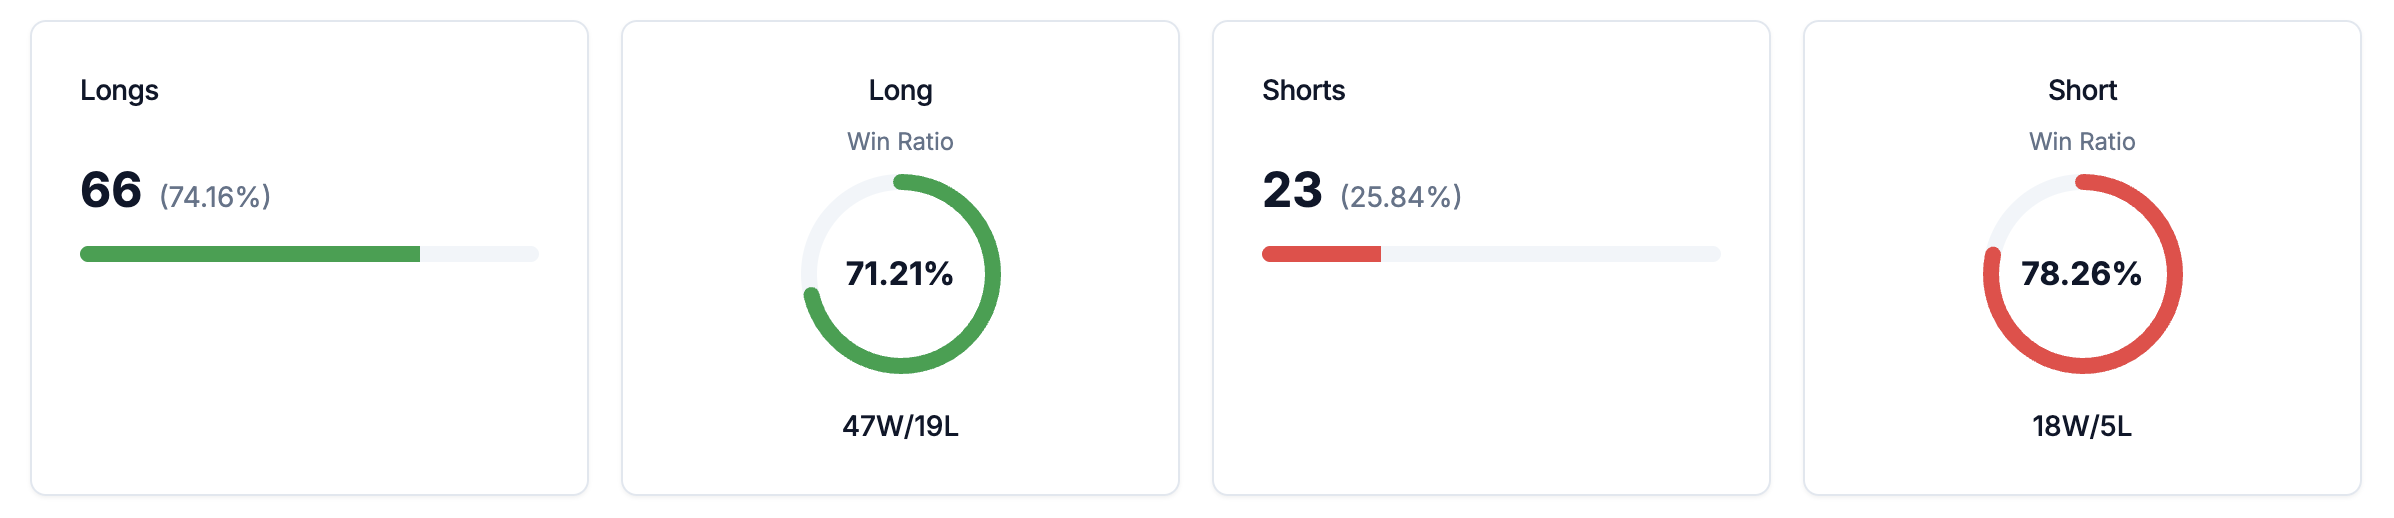
Insights Provided
- Win rate comparison
- PnL comparison
- Duration differences
Key Insights
- Discover directional edge
- Optimize bias based on market conditions
Day of Week Analysis
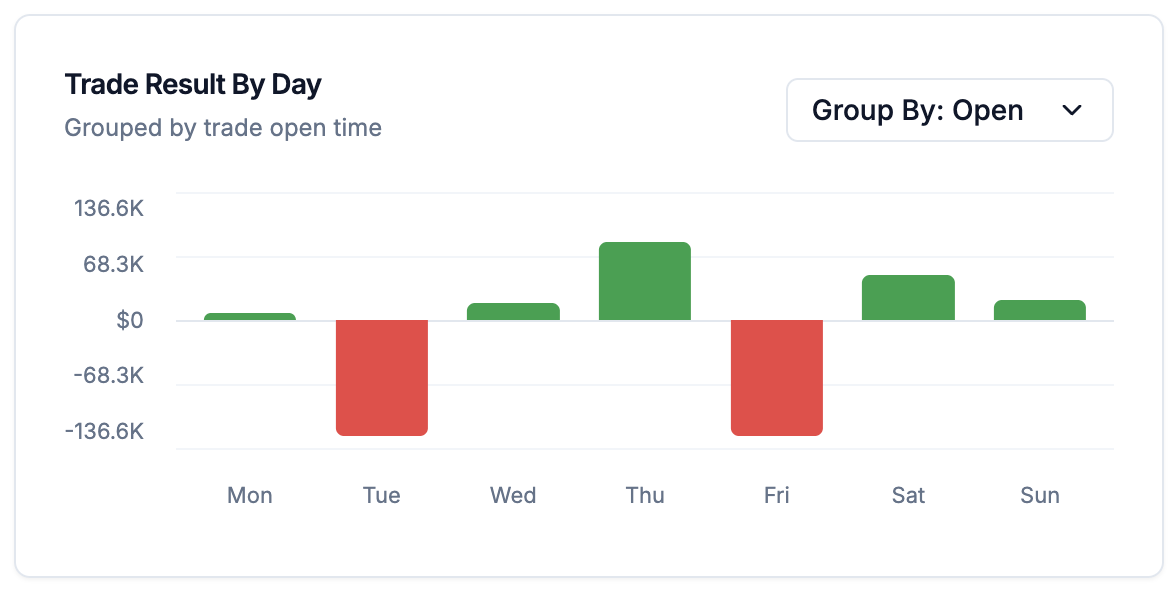
Key Insights
- Optimize trading schedule
- Avoid consistently underperforming days
Time of Day Analysis
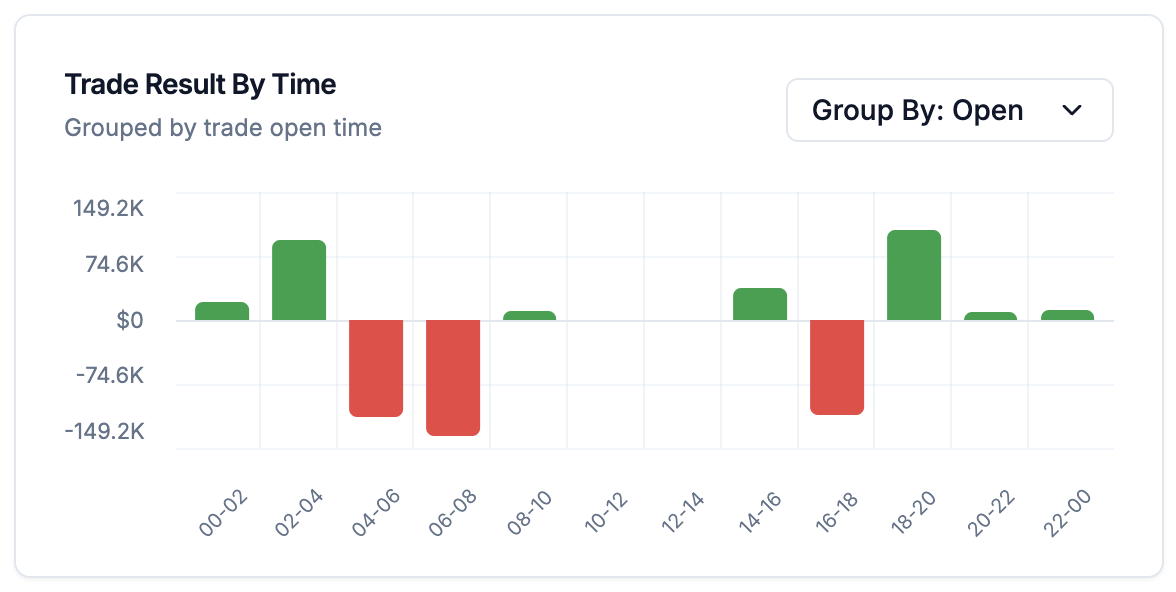
Key Insights
- Align trading activity with optimal market windows
- Especially useful for day traders and scalpers
Trading Session Analysis
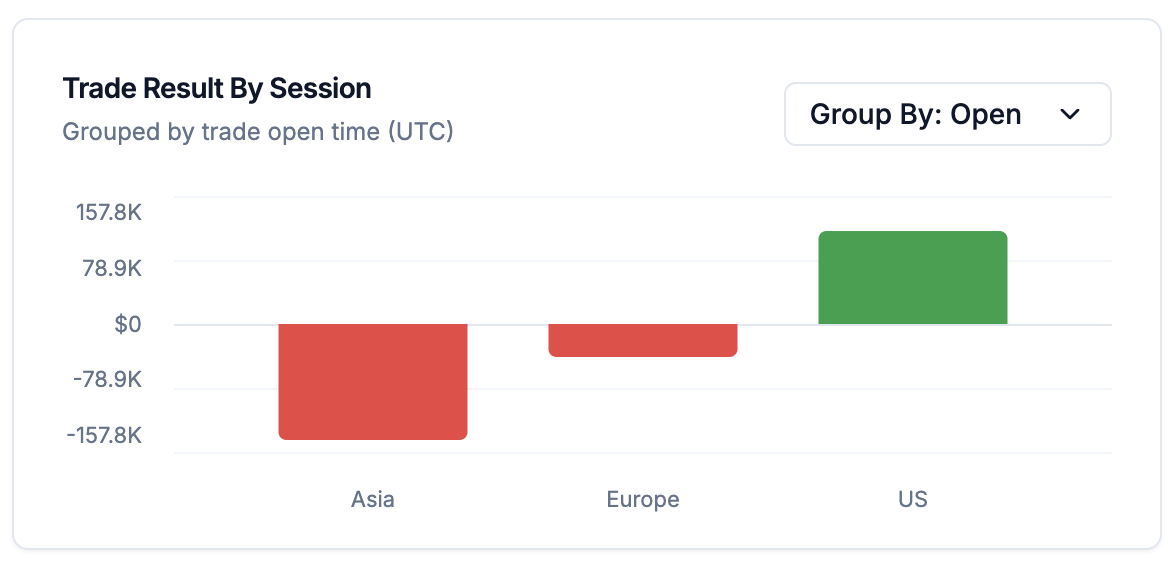
Key Insights
- Compare session-level PnL and activity
- Identify which sessions contribute most to gains or losses
Trade Duration Analysis
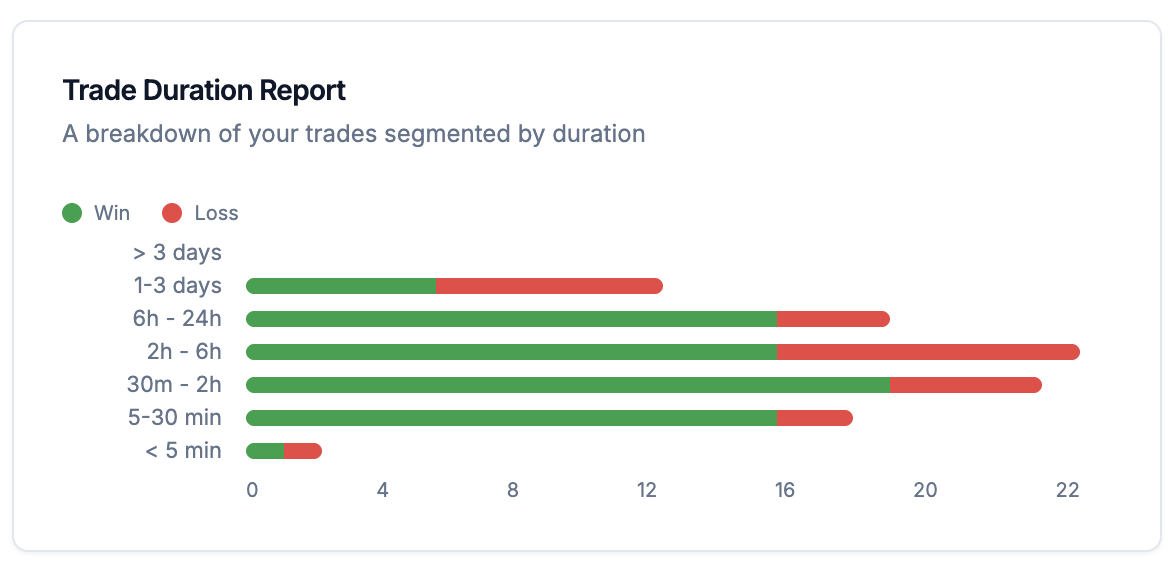
Duration Windows
- Very short-duration trades
- Intraday-duration trades
- Multi-day or longer-duration trades
Key Insights
- Understand your trading style
- Identify optimal holding periods
- Detect premature exits or overstaying positions
Order Type Analysis
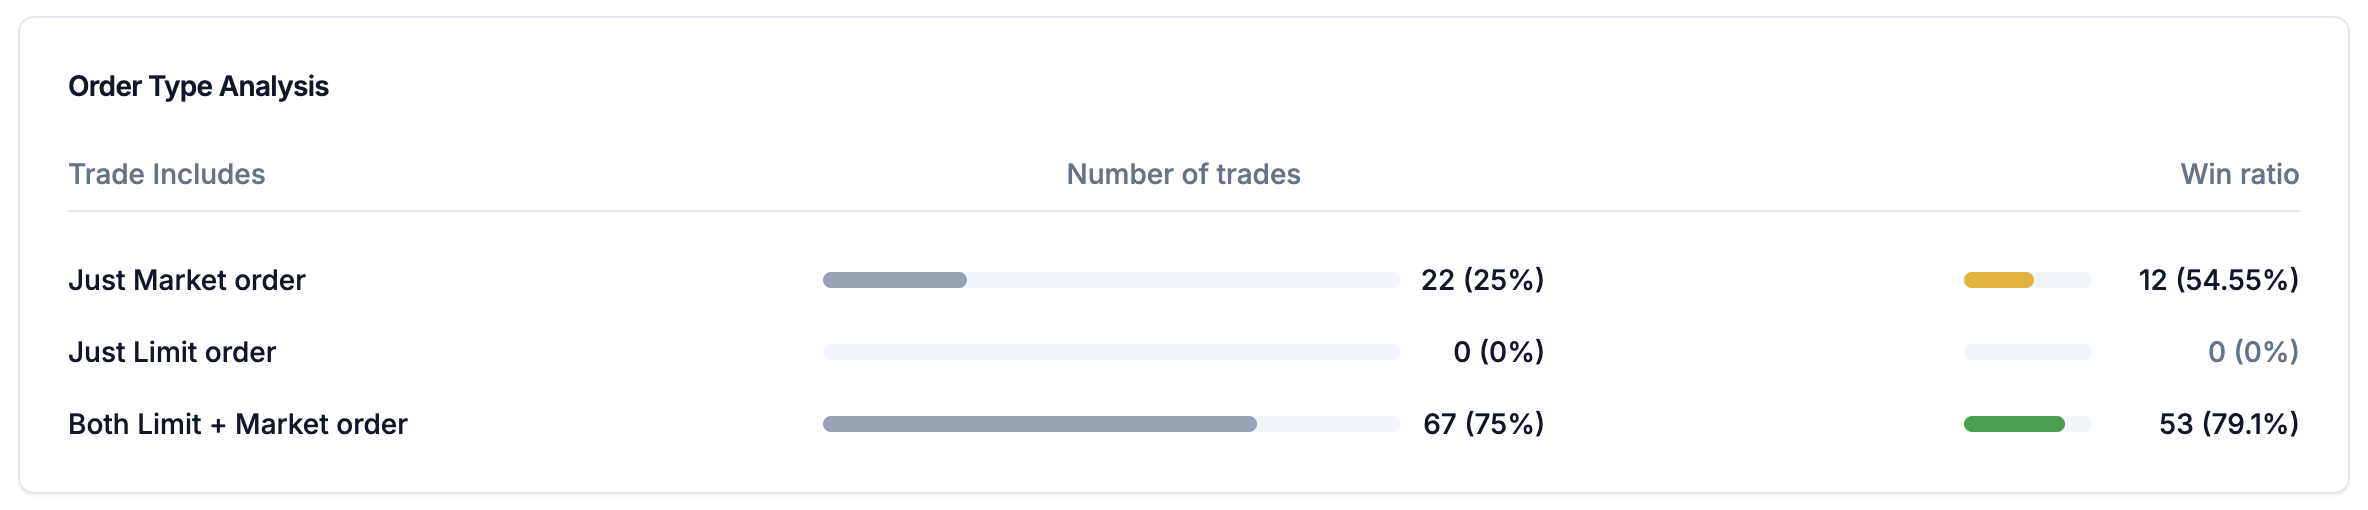
Key Insights
- Identify whether market or limit orders perform better
- Understand slippage and fill quality impact
Stop Loss Analysis
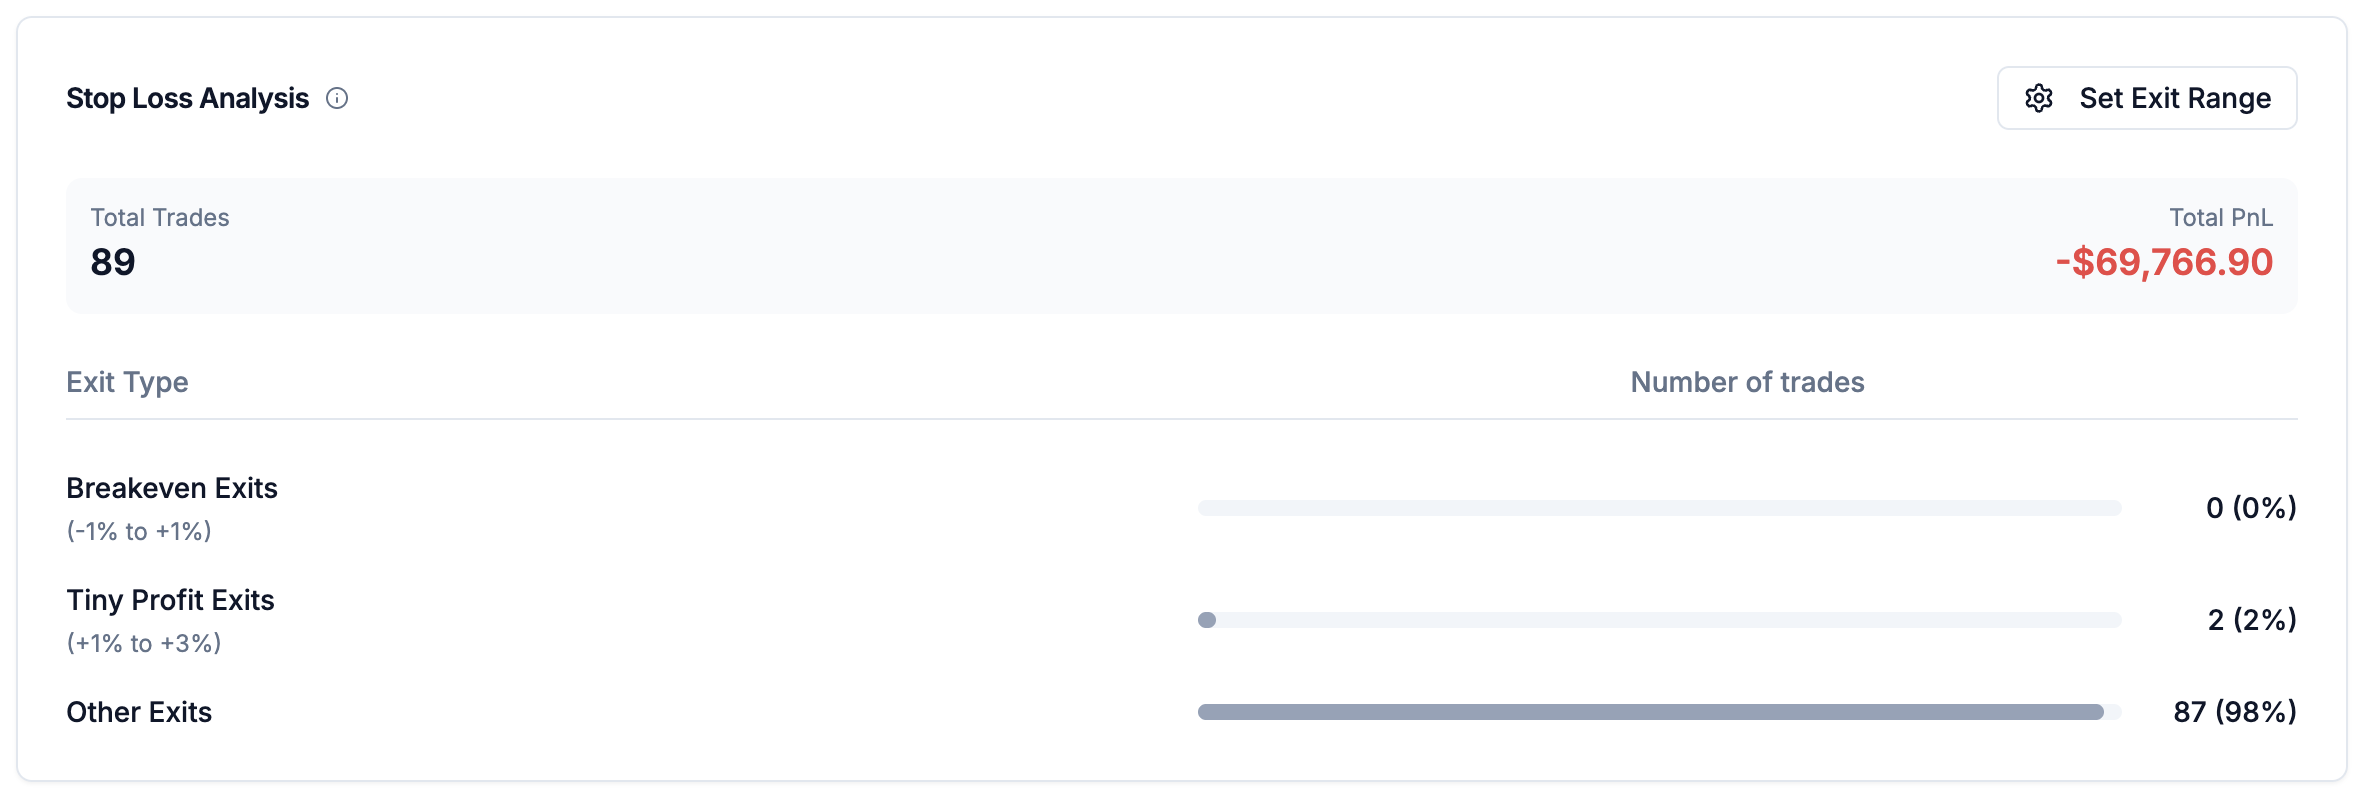
Key Insights
- Measure how often stop-loss exits close near flat or with small profits
- Compare stop-loss outcomes against other exit outcomes
- Refine stop placement and exit management
Fee Composition Breakdown
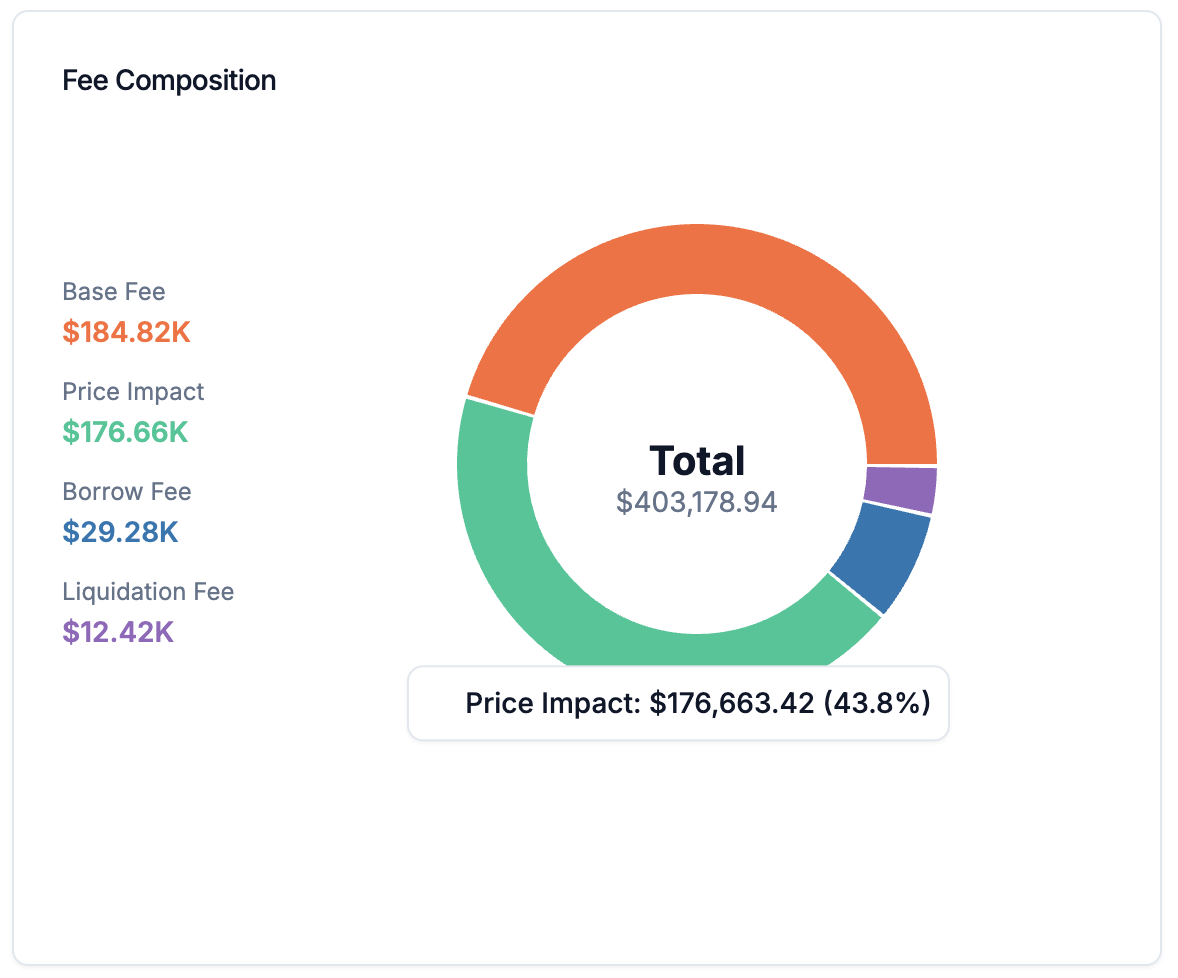
Jupiter Perpetuals
- Base Fee
- Price Impact Fee
- Borrow Fee
- Liquidation Fee
Backpack Exchange
- Maker Fee
- Taker Fee
- Funding Paid
Key Insights
- Understand true execution costs
- Optimize fee-efficient trading behavior
Cumulative Fees Chart
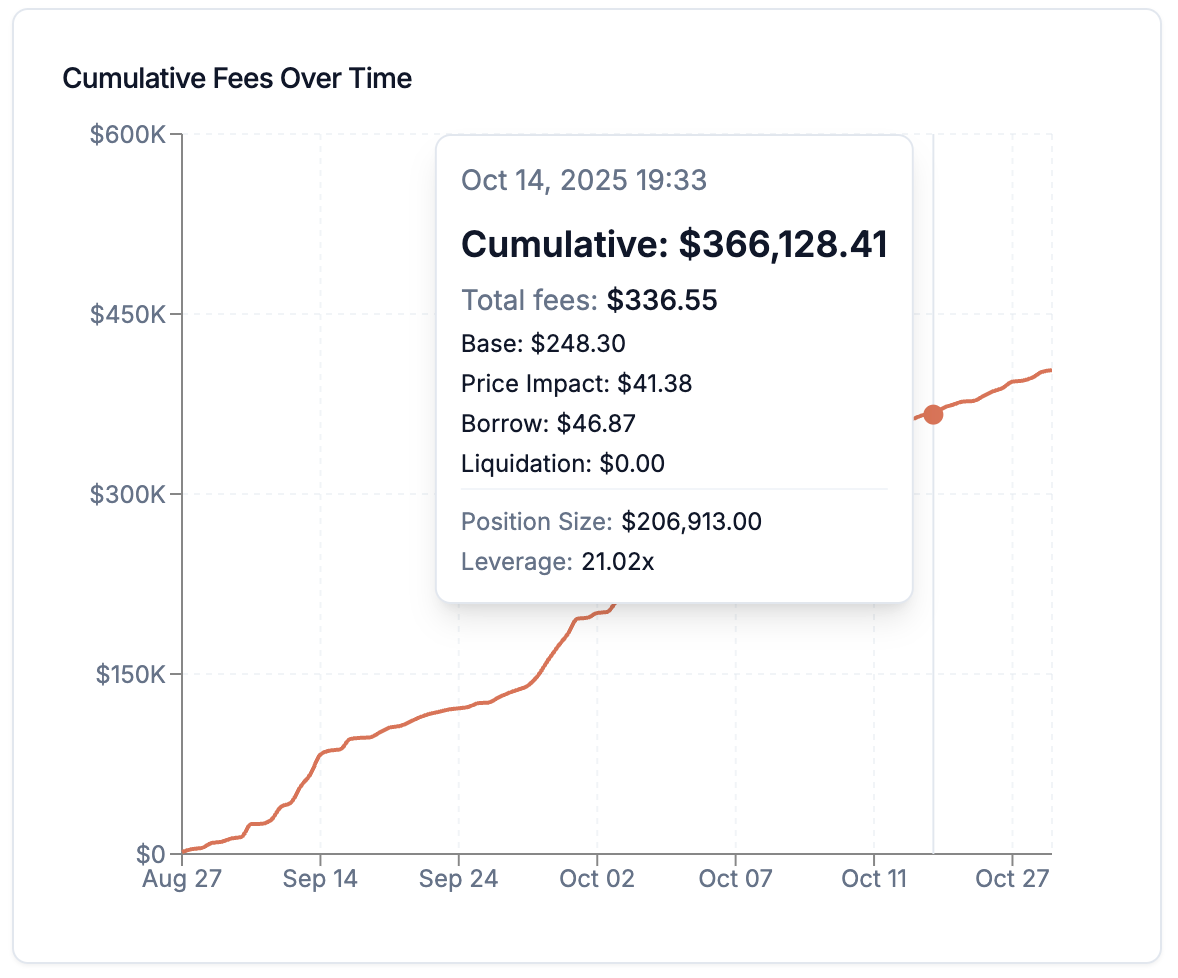
- Track cost growth over time
- Correlate fees with activity levels
Key Insights
- Detect inefficient trading frequency
- Compare fee growth vs. profitability
Exchange-Specific Features
Borrow / Lend Interest (Backpack Only)
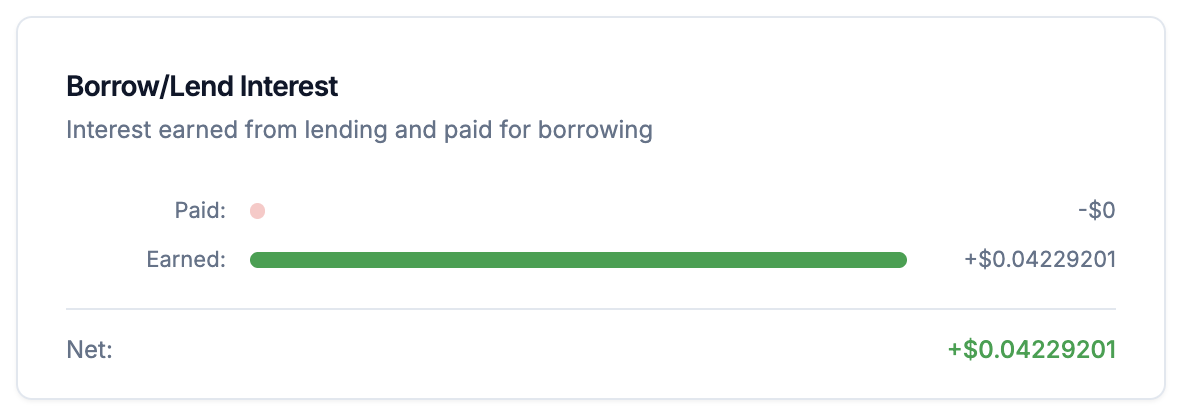
- Factor lending income and borrowing costs into net profitability
- Optimize lending opportunities and borrowing duration
Unrealized PnL Interest (Backpack Only)
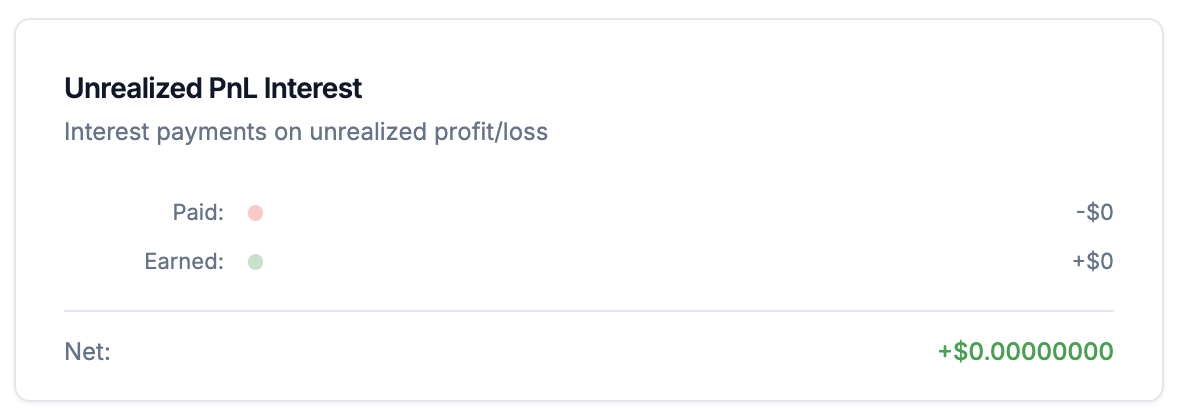
- Understand ongoing interest costs on unrealized PnL
- Factor unrealized interest into position management decisions
Symbol & Date Filters

How to use
- Symbol Filter: Select individual symbols or “All Symbols”
- Date Range: Choose custom start and end dates
Data Availability
- Jupiter: May 1st, 2025 onward (protocol data availability)
- Backpack: Full historical range based on your activity
Key Insights
- Compare performance across assets
- Identify which markets and periods suit your strategy best