
Performance Metrics Dashboard
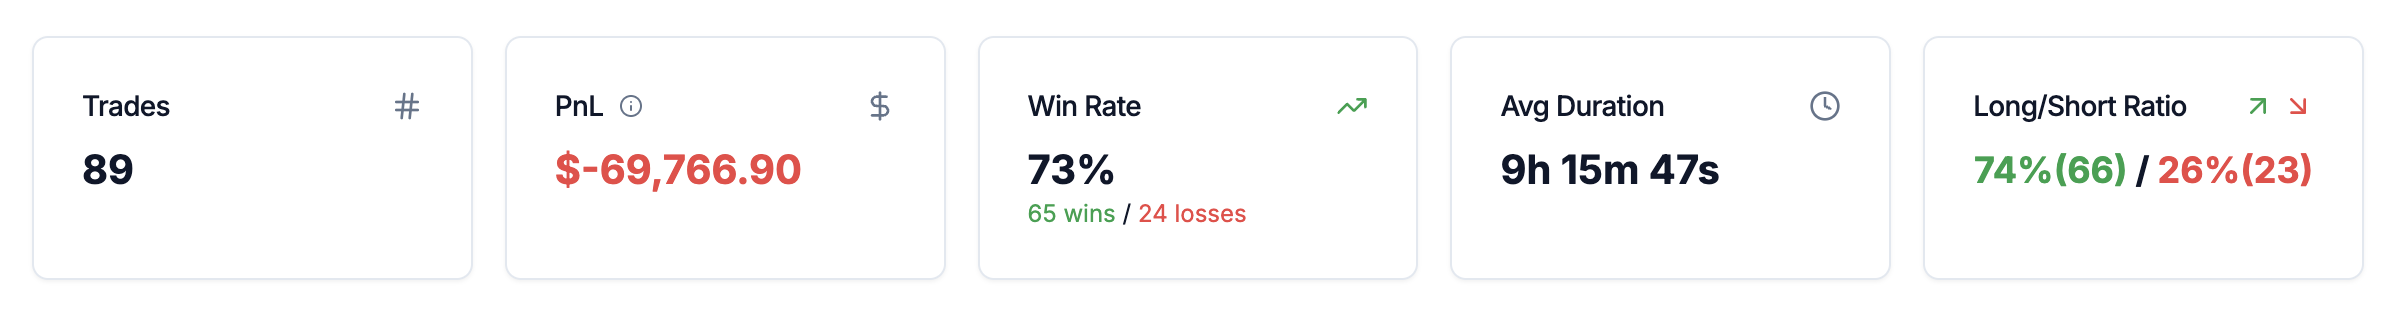
Metrics Included
- Trades — Total trades in the selected period
- PnL — Profit or loss for the selected period (filters applied)
- Win Rate — Percentage of winning trades with win/loss counts
- Average Duration — Mean holding time per trade
- Long / Short Ratio — Directional bias breakdown
Total PnL lives on Overview. This page’s PnL reflects the currently selected period and filters.
Key Insights
- Measure consistency and directional edge
- Understand holding behavior across different market regimes
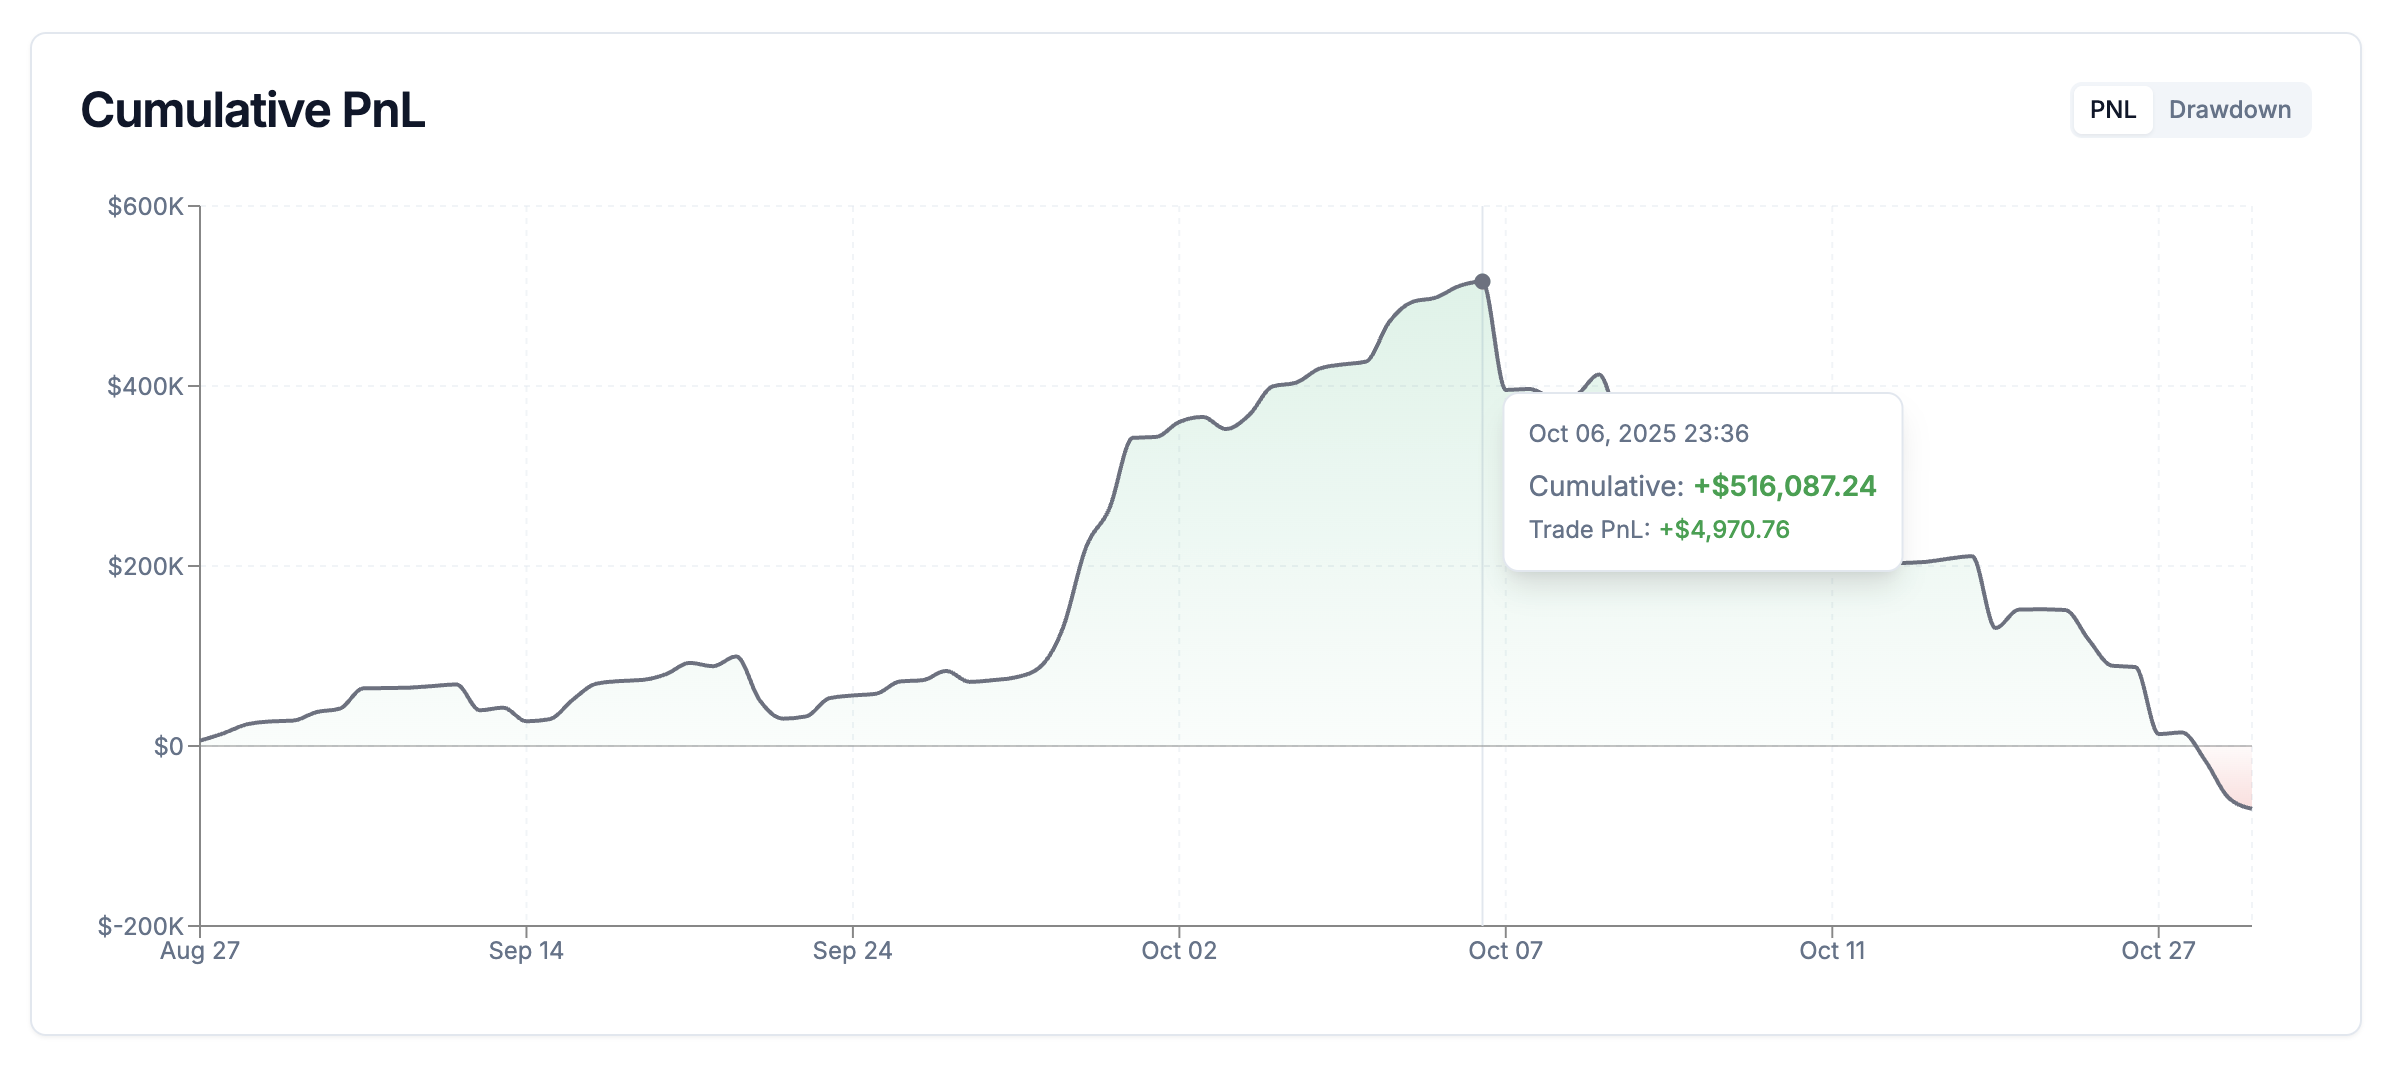
PnL Chart
How to use
- View PnL progression over time
- Hover for exact values
- Fully respects active filters
- Toggle between PnL and Drawdown views
Key Insights
- Identify strong and weak performance phases
- Evaluate consistency versus volatility
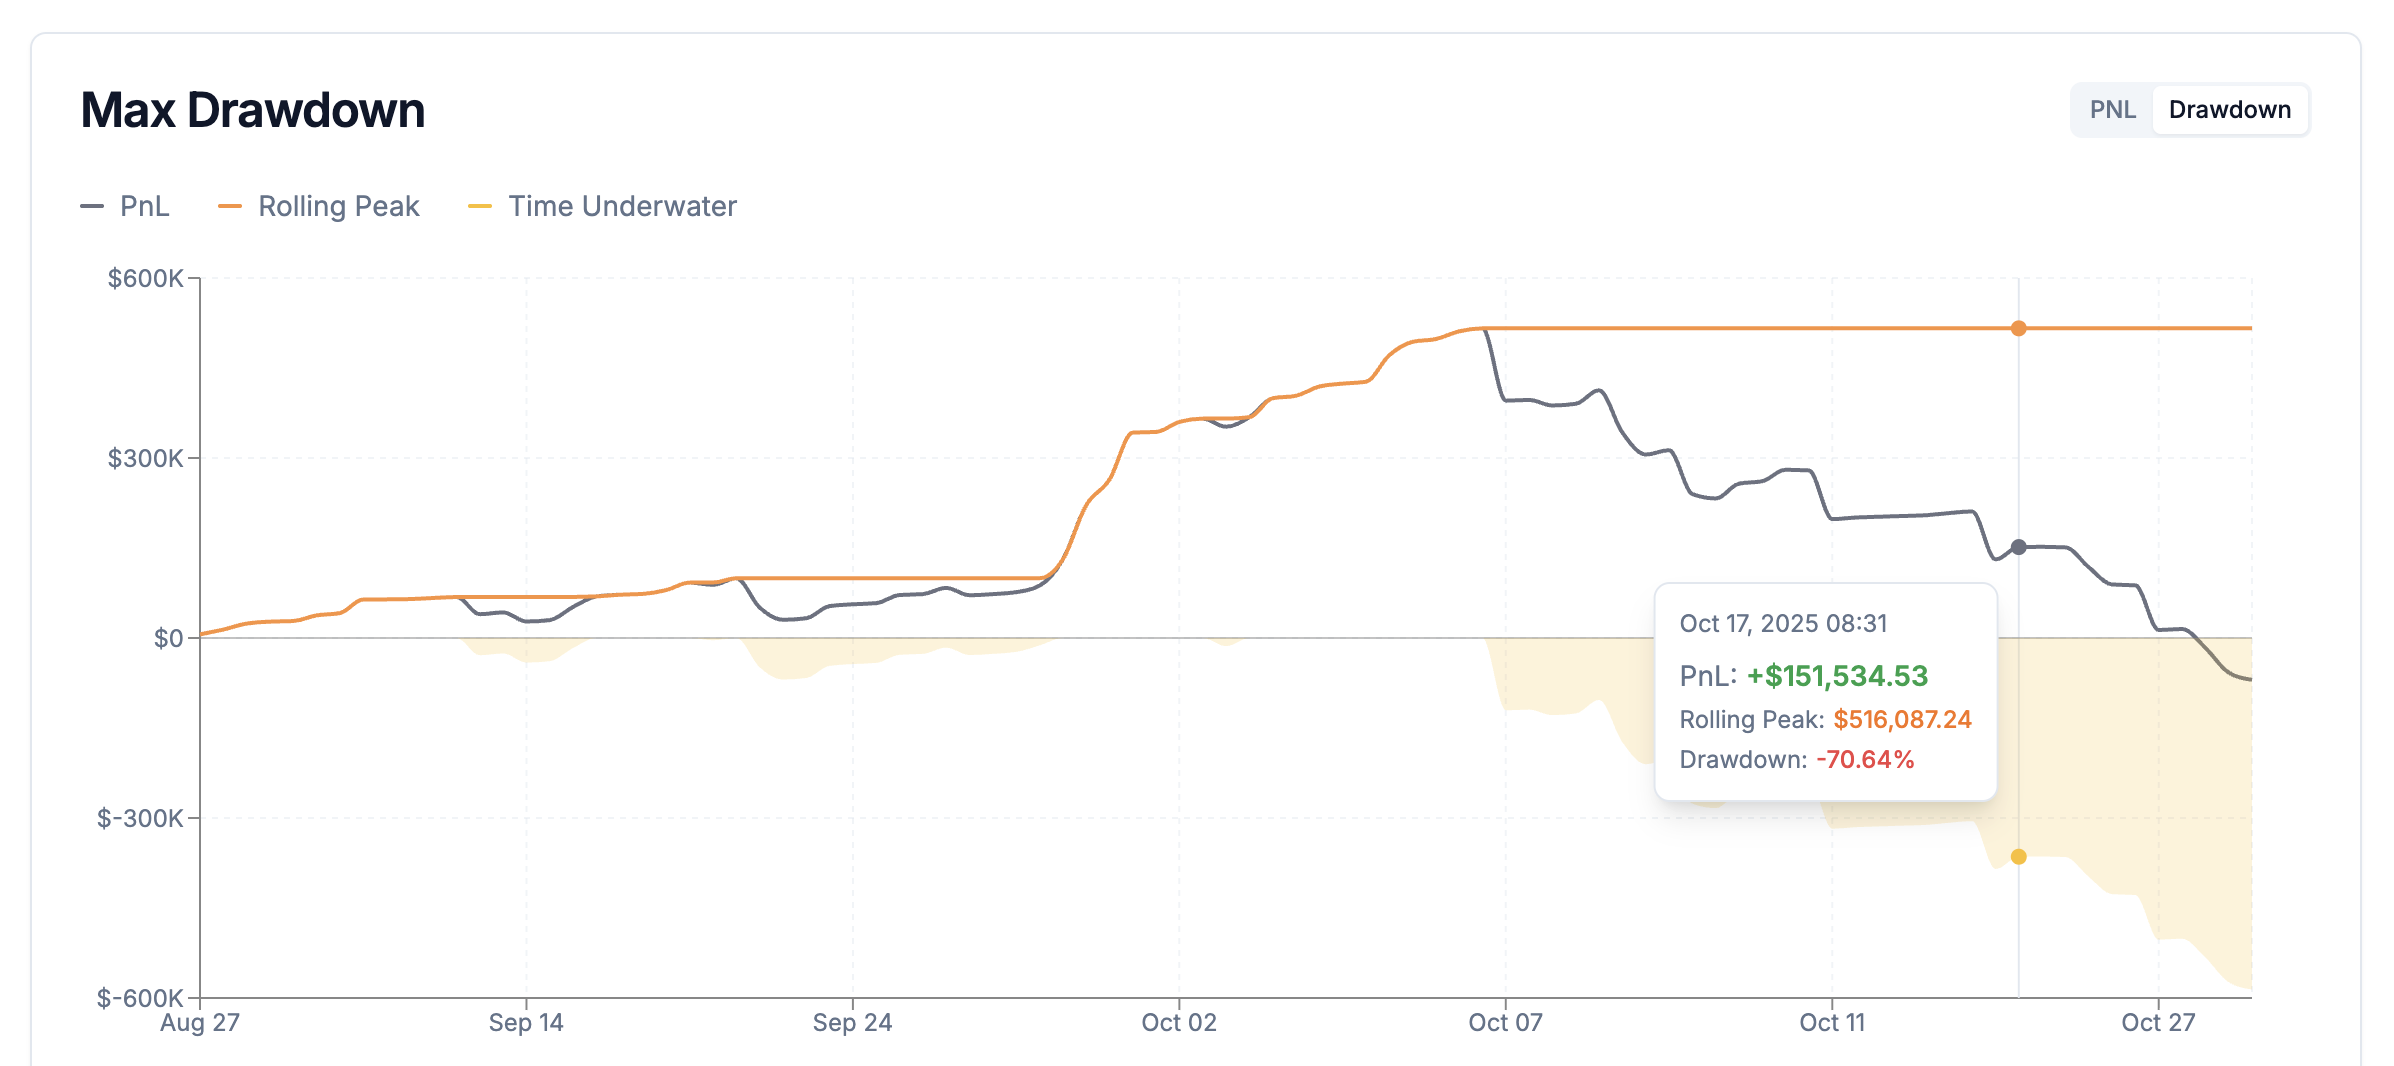
Drawdown Chart
How to use
- View percentage drawdown from historical peaks
- Identify maximum drawdown periods
- Switch via chart mode selector
Key Insights
- Understand worst-case scenarios
- Evaluate whether risk aligns with your tolerance
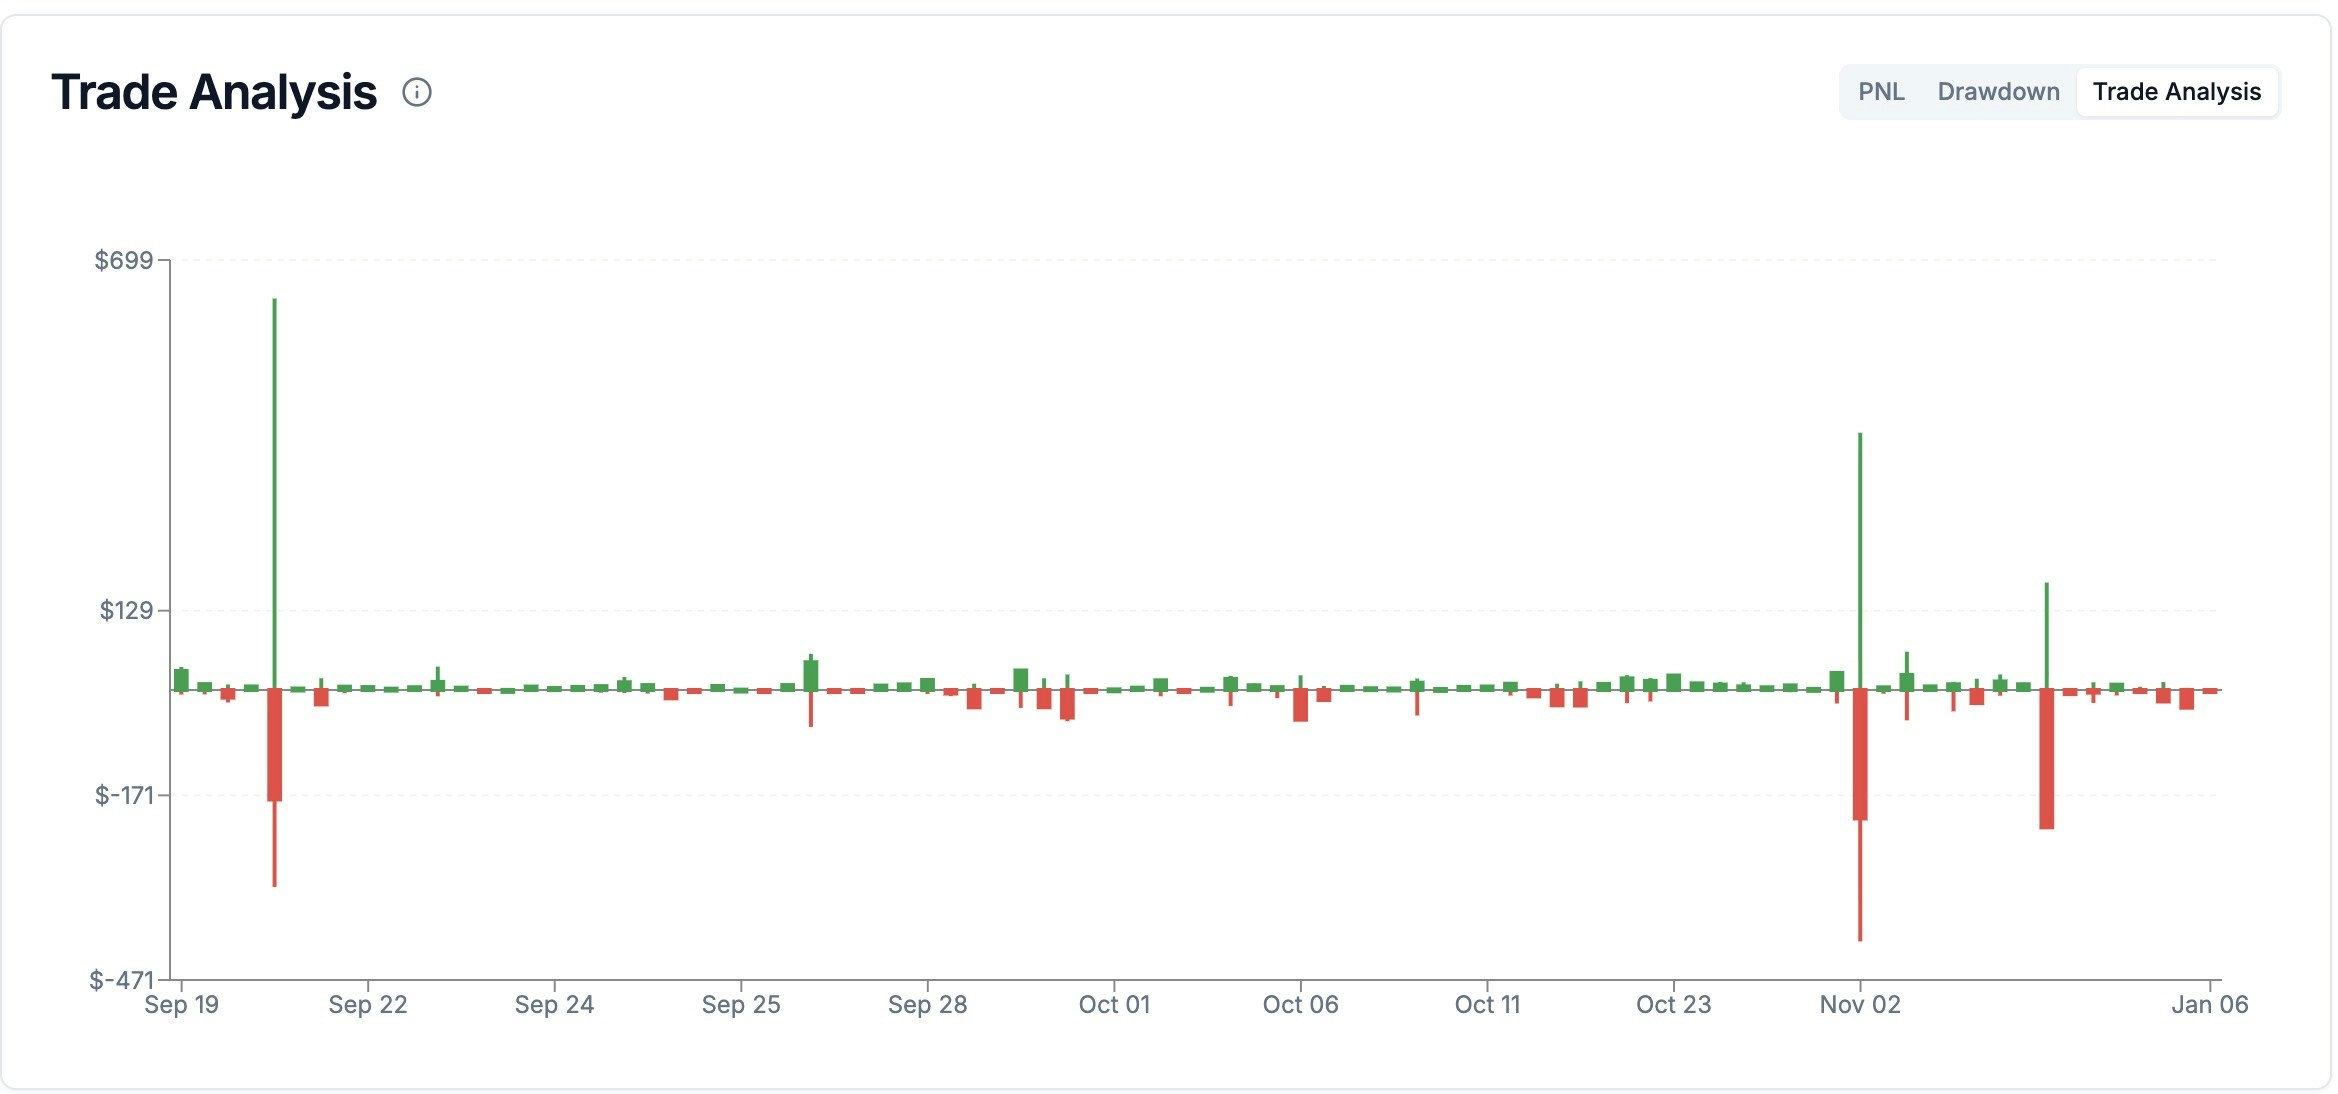
Trade Analysis Candles
How to use
- Identify trades where you gave back large unrealized profits
- See which entries go deep into drawdown before working
- Compare trade management quality across different market conditions
- Use alongside filters to analyze specific symbols, dates, or strategies
Key Insights
- Reveal execution inefficiencies that normal PnL metrics hide
- Improve stop-loss placement and profit-taking decisions
Time Period Performance

How to use
- Review PnL and trade count per time bucket
- Spot profitable and unprofitable periods
Key Insights
- Detect seasonality and streak behavior
- Understand performance concentration
Symbol & Date Filters

How to use
- Symbol Filter: Select individual symbols or “All Symbols”
- Date Range: Choose custom start and end dates
Data Availability
- Jupiter: May 1st, 2025 onward (protocol data availability)
- Backpack: Full historical range based on your activity
Key Insights
- Compare performance across assets
- Identify which markets and periods suit your strategy best